Monitoring Metrics and Logs
Overview
This tutorial guides you through the process of viewing and querying machine metrics and logs in Mecha Console. Monitoring these data points helps ensure your machines are performing optimally and aids in troubleshooting issues.
Viewing Machine Metrics
-
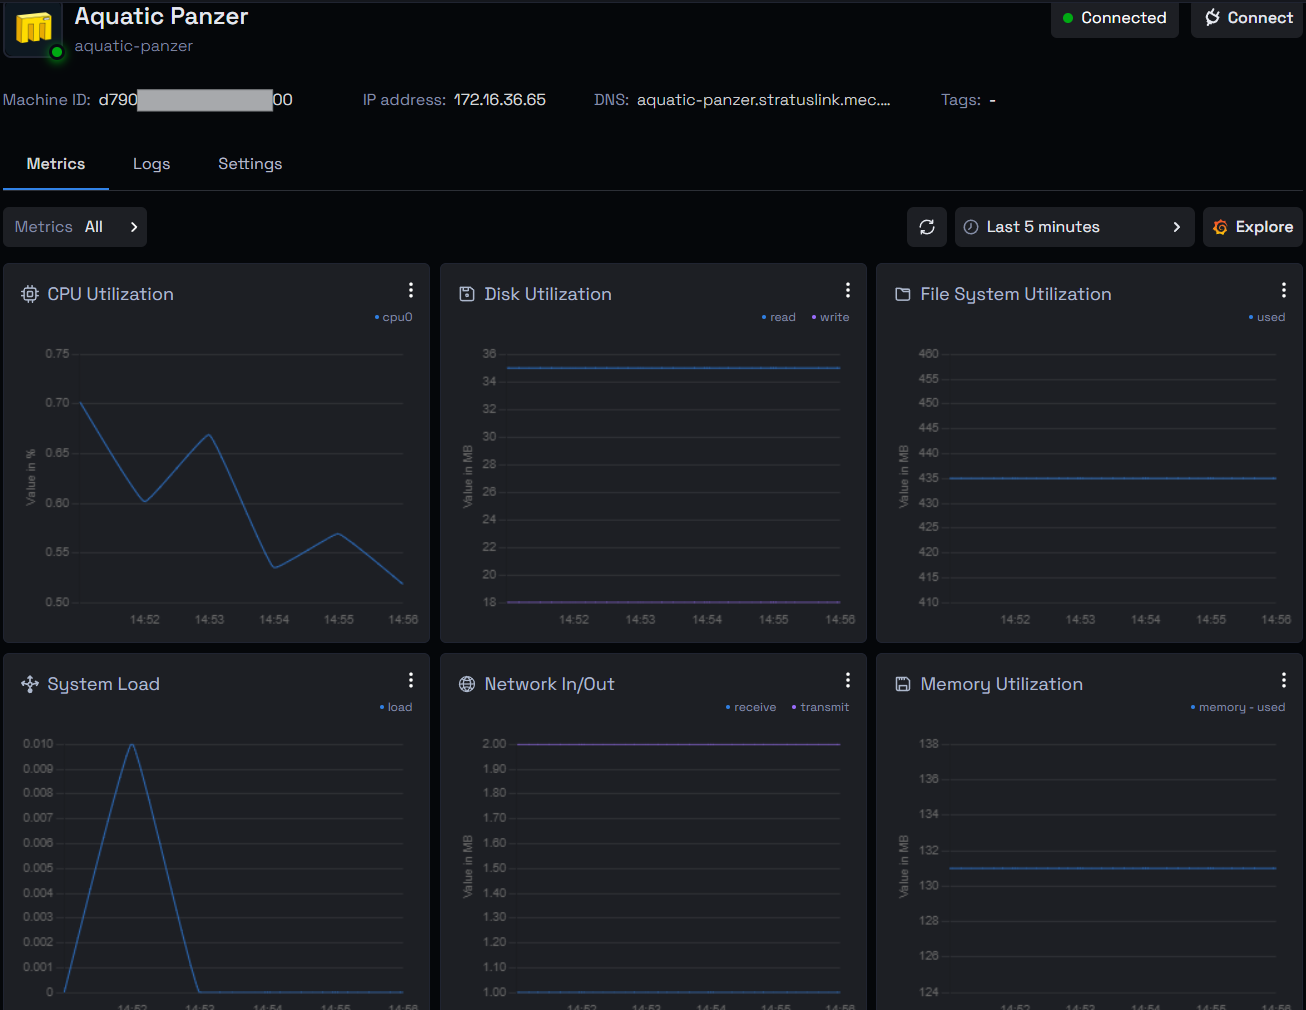
Access Metrics Dashboard:
- Navigate to the Metrics section from your machine details.
-
View Metrics:
- Review the available metrics such as CPU usage, Disk memory usage, Filesystem usage, System load and Network activity.
- Hide/View Specefic Metrics:
- Apply filters to view specific metrics or focus on particular data points to suit your need.

- Time Query:
- Apply filters based on time to view specific metric data for a selected period.

-
Analyze Results:
- Review the results and use them to assess performance or identify issues.
-
Refresh Metrics
- Click the refresh button to get the latest, real-time values for the metrics.
-
Explore in Grafana
- Clicking on "Explore" will automatically open the Grafana service without requiring additional authentication. In Grafana, you can access machine metrics and logs directly in real time and use all available features to further filter and analyze data.
Viewing Machine Logs
-
Access Logs Dashboard:
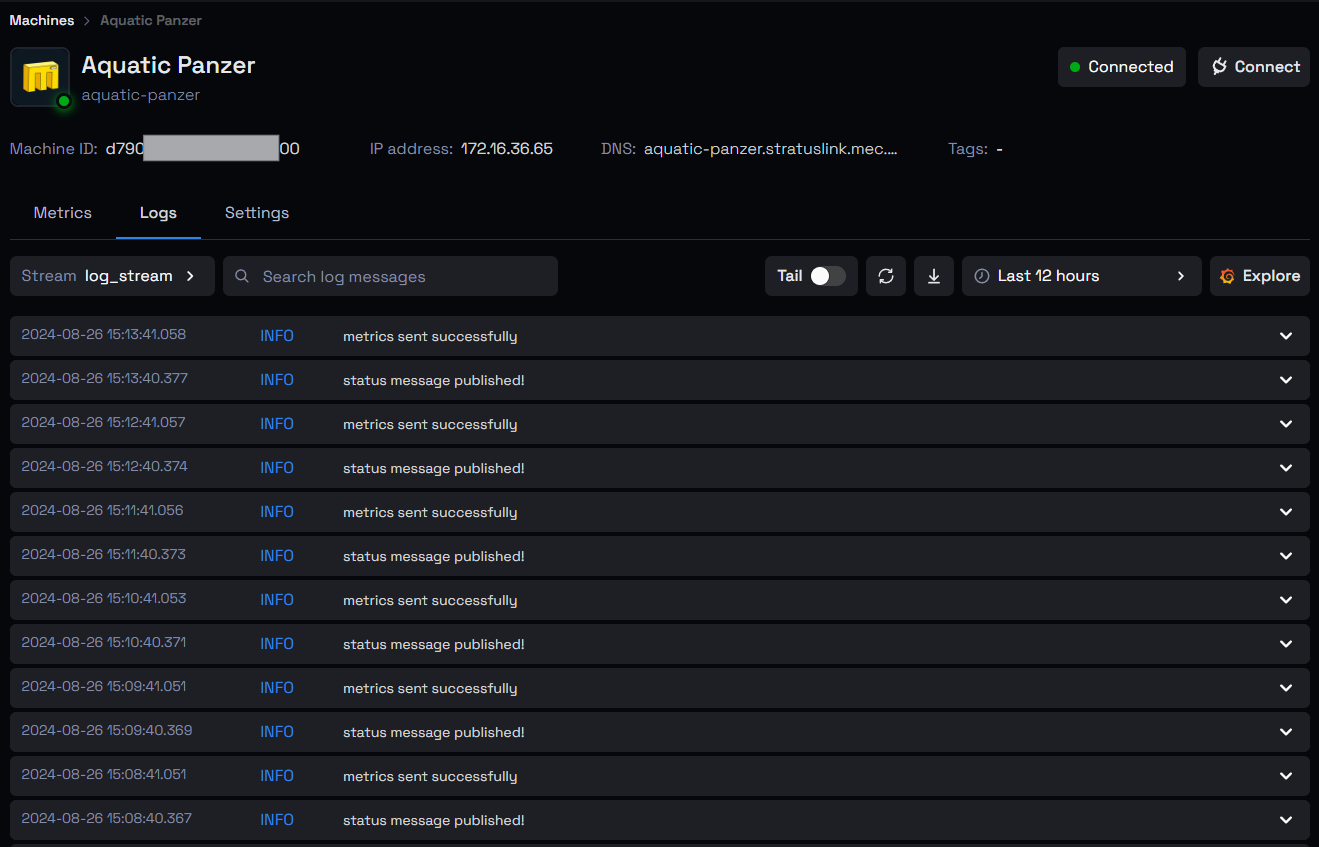
- Navigate to the Logs section from your machine details.
-
View Logs:
- Review the available logs for your machine. At the end of the list, you can click on 'Fetch more logs' to load more logs
-
Query Logs
3.1. Time-Based Filters
- Apply filters based on time to narrow down the logs to a specific period.
3.2 Search Within Logs
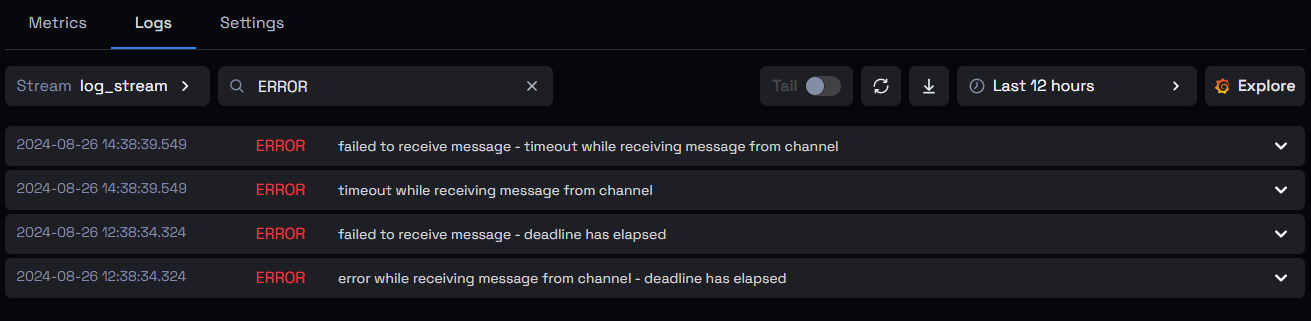
- Utilize the search function to find specific entries or keywords within the logs. Use filters to find logs by severity, such as
INFO,WARN,ERROR, or any other custom log levels your system uses.
-
Tail Toggle
- Enable the tail toggle to automatically add the latest logs on top every 10 seconds.
-
Download Logs
- Download all logs or filtered logs as a text file.
-
Refresh Logs
- Click the refresh button to get the latest, real-time log entries.
-
Explore in Grafana
- Clicking on "Explore" will automatically open the Grafana service without requiring additional authentication. In Grafana, you can access machine logs in real-time, apply additional filters, and utilize all available features to analyze the log data further.
Conclusion
By following these steps, you can effectively monitor and analyze machine metrics and logs. Regularly checking these data points helps maintain optimal performance and quickly resolve issues.