Query Logs On Grafana
Step 1: Log In to Your Mecha Console
- Start by logging into your Mecha Console using your credentials.
Step 2: Navigate to the Machines Section
- From the top menu, click on Machines to access the list of machines.
- Alternatively, if the machine is listed on the Console home, you can select it directly from there.
Step 3: Select the Machine
- Choose the machine for which you want to check the metrics.
- After selecting the machine, go to the Logs section.
Step 4: Explore Logs in Grafana
- In the Logs section, click on the Explore button.
- This action will automatically open the Grafana service without requiring additional authentication.
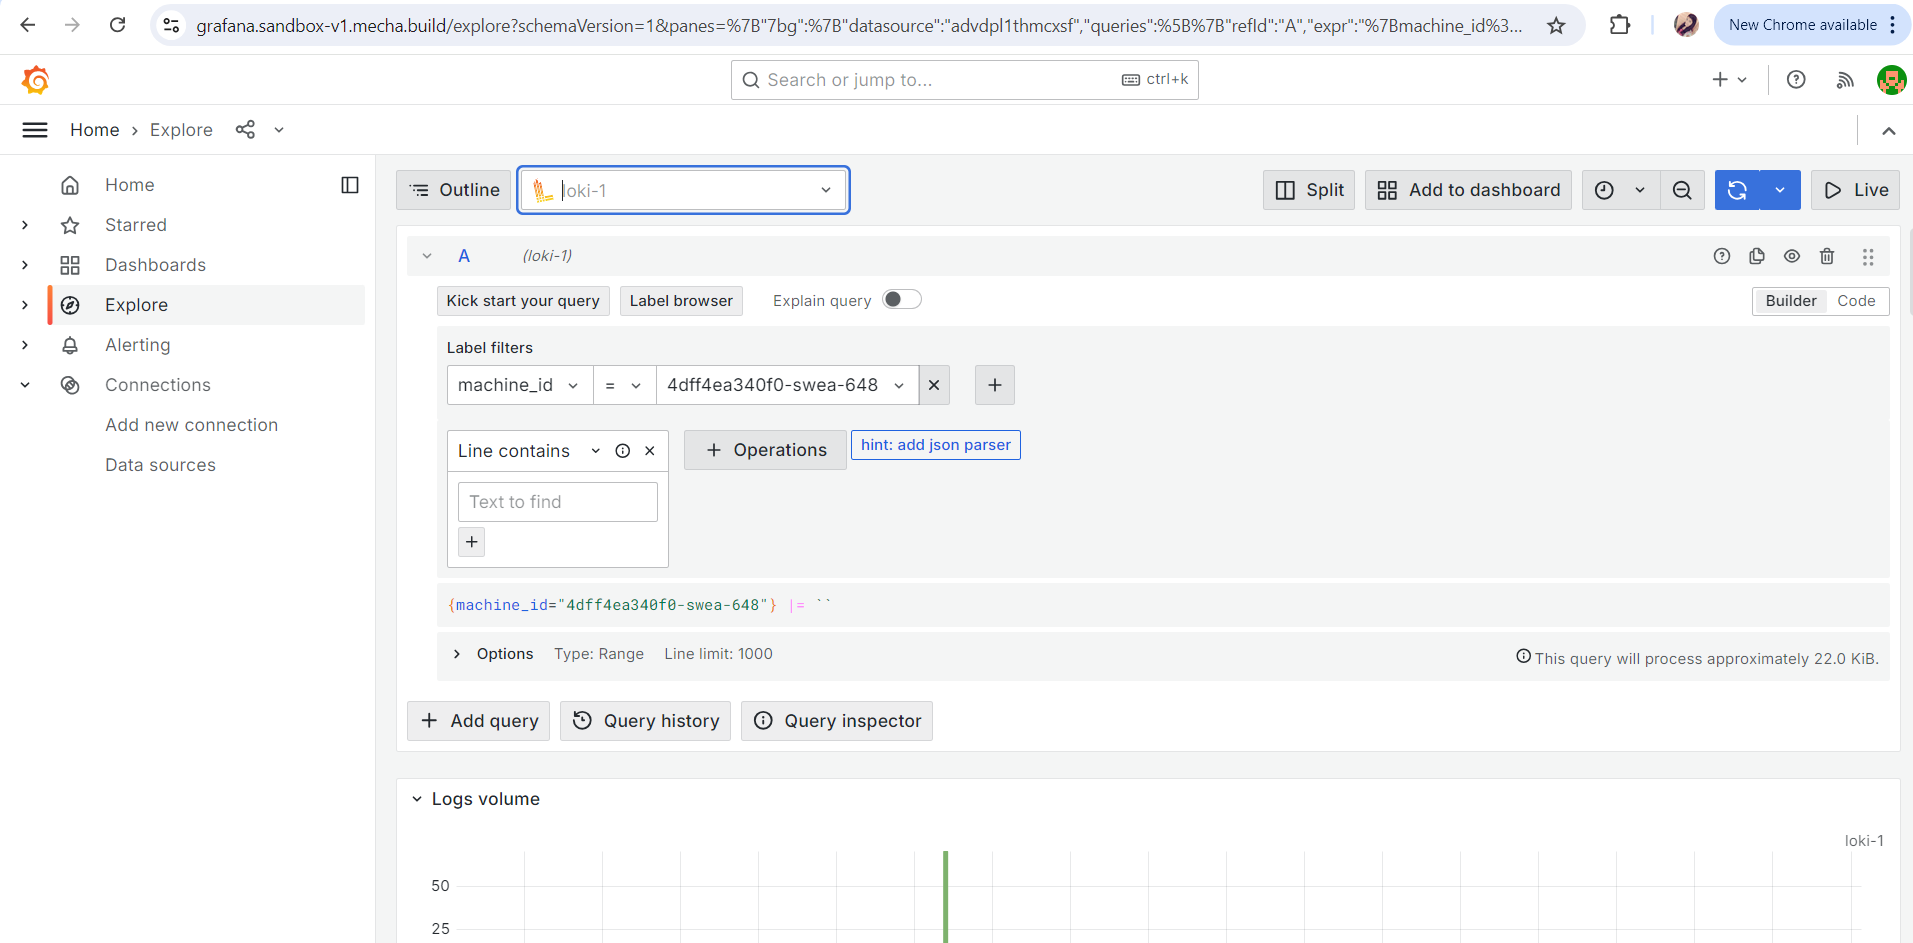
- Ensure that the selected data source is Loki.
Step 5: Apply Relevant Filters
- In label filters, select
machine_idfor viewing logs. - You can also select the machine and filter logs according to
machine-alias.
Step 6: Set the Time Range
- Choose the time range you want to query logs for. This helps in narrowing down to specific events within a given period.
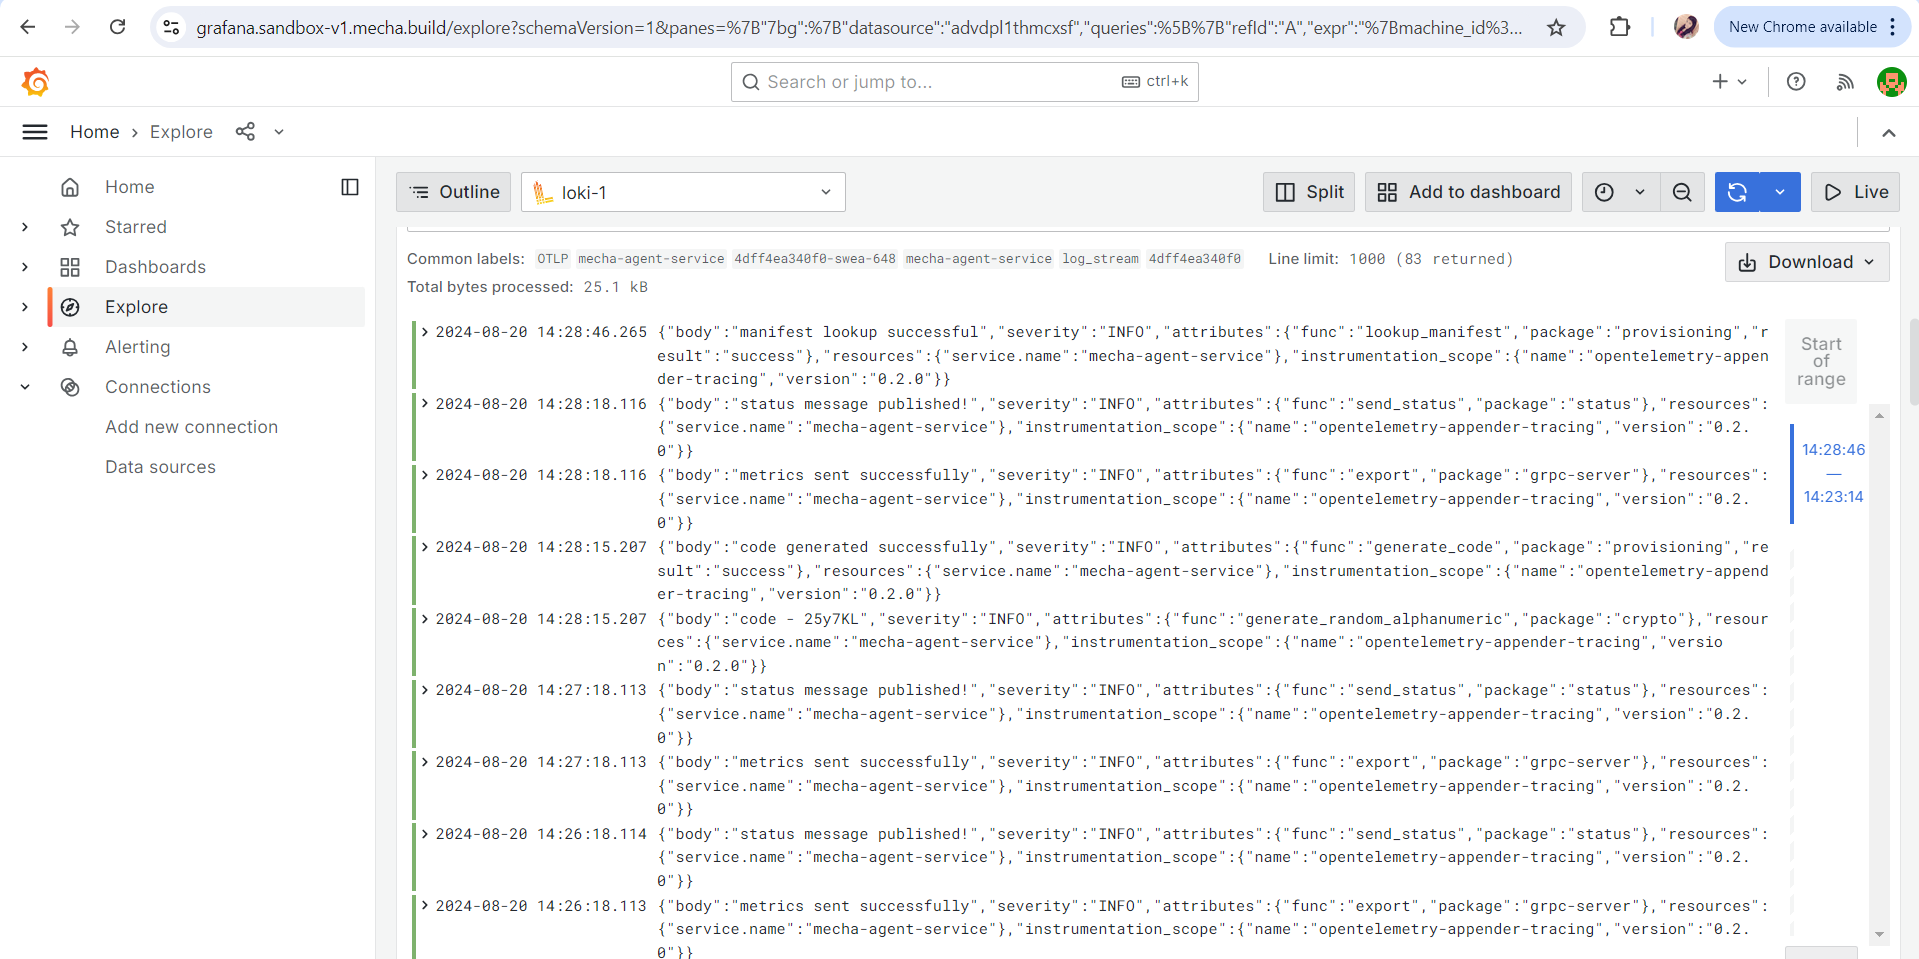
Step 7: View and Analyze Logs
- The logs will be displayed in real-time, allowing you to monitor the machine’s activities and diagnose issues.
- Use the available options to further refine your queries or add new ones for deeper analysis.
Step 8: Download Logs
- If needed, you can download the logs by clicking on the Download button, allowing you to save them for further analysis or record-keeping.
Screenshot Reference: