Retrieving Machine Logs & Metrics
Logs and metrics are complementary tools in machine monitoring, with logs providing detailed event data and metrics offering a high-level view of system performance. Together, they enable comprehensive monitoring, proactive issue detection, and effective troubleshooting.
-
Overview
-
Logs : For logs collection loki is used.
Loki is well-suited for aggregating, storing, and visualizing machine logs. It provides an effective solution for handling large volumes of log data generated by machines, whether they are servers, containers, or virtual machines Loki uses its own query language called LogQL. LogQL is specifically designed for querying and analyzing logs in Loki
Loki has below benefits,
- Log Retention Policies:
- Define log retention policies to manage storage effectively. Decide how long logs should be kept based on compliance requirements and storage capacity.
- Resource Management:
- Monitor Loki’s resource usage (CPU, memory, storage) and scale its components as needed to handle the volume of machine logs.
- Security and Access Control:
- Secure access to Loki and Grafana with proper authentication and authorization. Ensure that sensitive log data is protected and accessible only to authorized users.
- Log Retention Policies:
-
Metrics : For metrics Prometheus is used.
Prometheus is primarily used for collecting and querying metrics data from various sources. It focuses on time-series data, which includes metrics such as CPU usage, memory consumption, and application performance.
PromQL: Prometheus Query Language (PromQL) is used to query metrics data. It allows users to perform complex queries, aggregations, and calculations on time-series data.
Similar to logs, there is retention policy for metrics to configure appropriate retention policies and storage solutions to handle the volume of metrics data.
-
-
Setting Up Basic Machine Telemetry
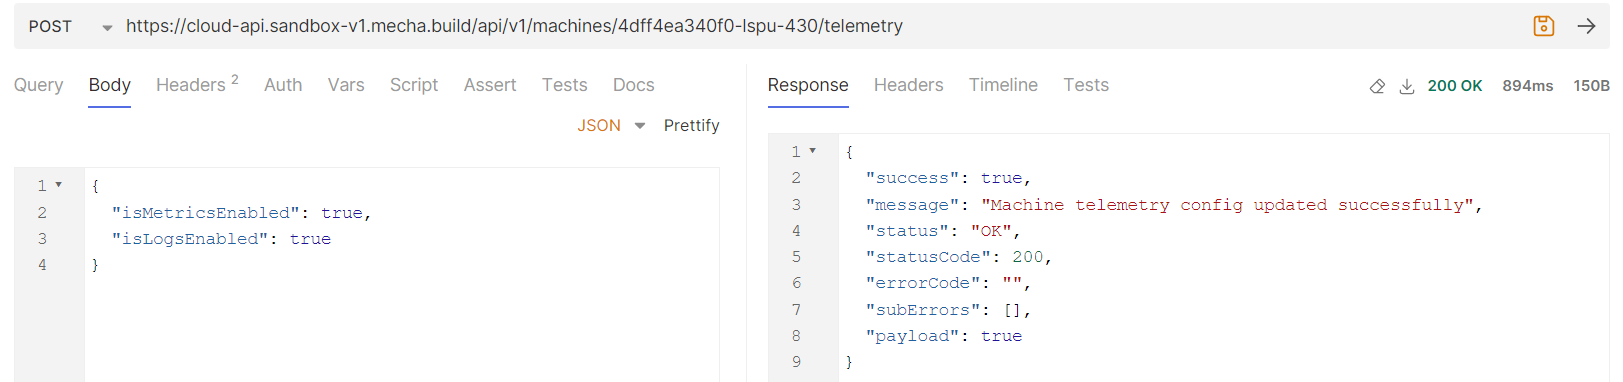
- Configuring Telemetry Data Collection (enable or disable telemetry) : Configuring telemetry for logs and metrics is a critical aspect of managing and monitoring systems effectively. By enabling or disabling specific telemetry features, you can balance the need for insightful data with the performance, privacy, and compliance requirements of your environment. Whether through configuration files, environment variables, or a user interface, these settings give you control over how much data is collected and how it is used.
Using Add or update telemetry data API for the machine with machine ID or machine alias. Enabling or disabling logs and metrics collection can be done. With this API machine settings for logs and metrics are updated and depending on settings logs and metrics data is collected if enabled or not collected if disabled.
Reference : Bruno screenshot
-
Retrieving machine logs and metrics data
-
Get metrics data :
To get metrics data for the machine using machine ID or machine alias.The metrics data can be filtered based on specific metrics labels and a given time range. Metrics labels list :
- SYSTEM_CPU_UTILIZATION - This metric measures the percentage of the CPU's total capacity that is being used by the system at any given time.
- SYSTEM_MEMORY_USAGE - This metric tracks the amount of system memory (RAM) being used by applications and the operating system compared to the total available memory.
- SYSTEM_CPU_LOAD_AVERAGE_15M - The CPU load average over 15 minutes represents the average number of processes waiting to be executed or currently executing in the system's run queue during this time frame.
- SYSTEM_NETWORK_IO - This metric measures the amount of data being sent and received by the system over the network interface, typically in bytes per second.
- SYSTEM_DISK_IO - Disk I/O measures the rate at which data is read from or written to the disk. This metric is typically measured in operations per second or in bytes per second.
- SYSTEM_FILESYSTEMS_USAGE - This metric tracks the usage of different filesystems on the system, showing how much disk space is used versus available on each filesystem.
start, end : Timestamp in epoch seconds timeInterval :
- The interval at which the metrics data should be aggregated.
- Possible values:
1s,60s,2m,5m,10m,1h,1d
Below is request example for SYSTEM_CPU_UTILIZATION,
Reference : Bruno screenshot
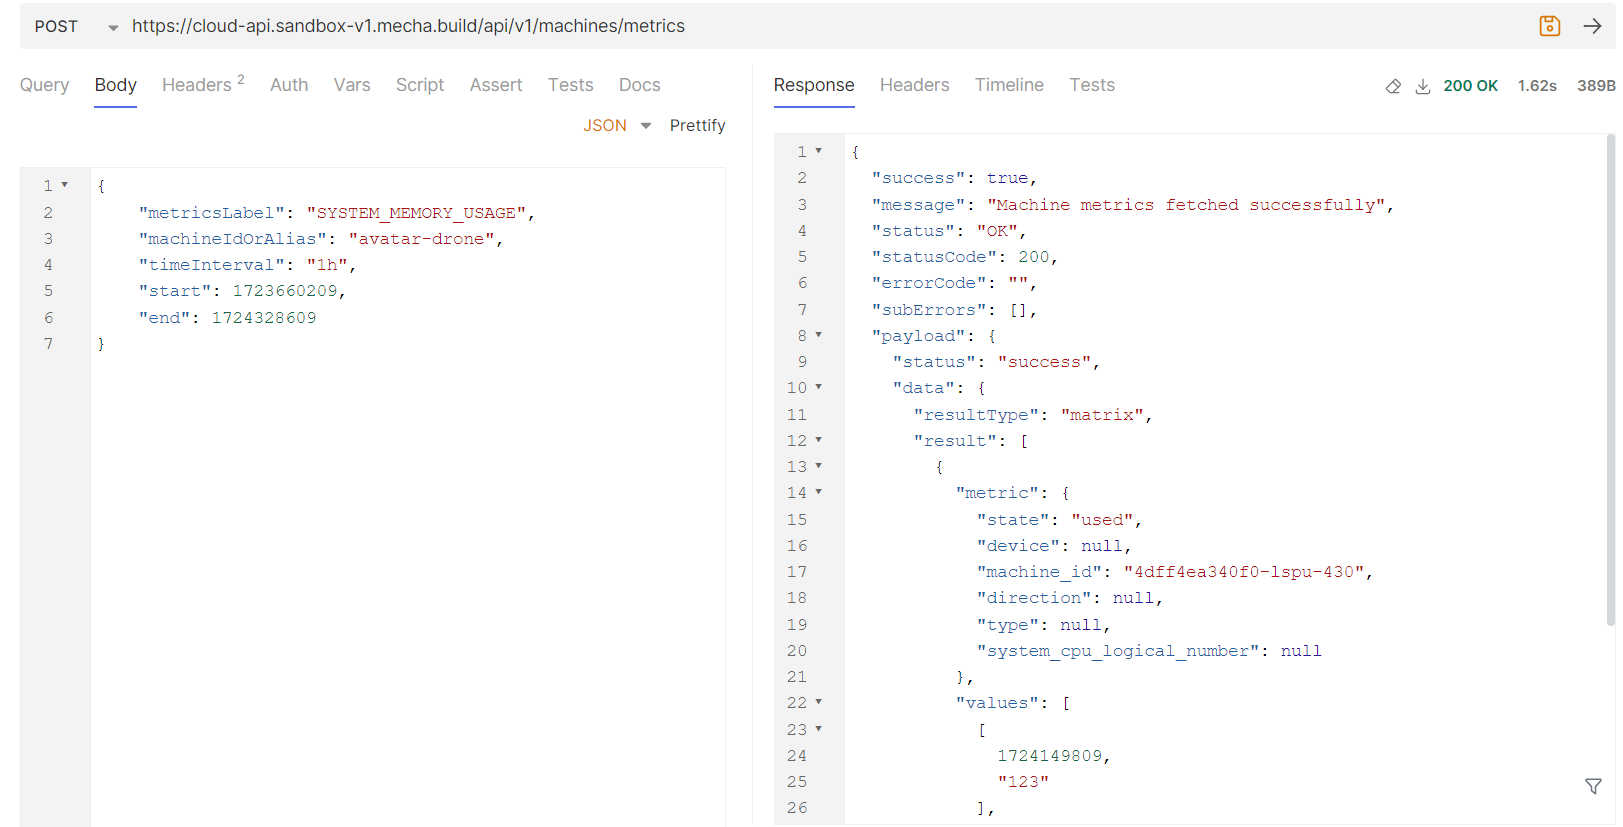
Note : Metrics data is only collected if metrics collection is enabled in machine telemetry
-
Get logs Data :
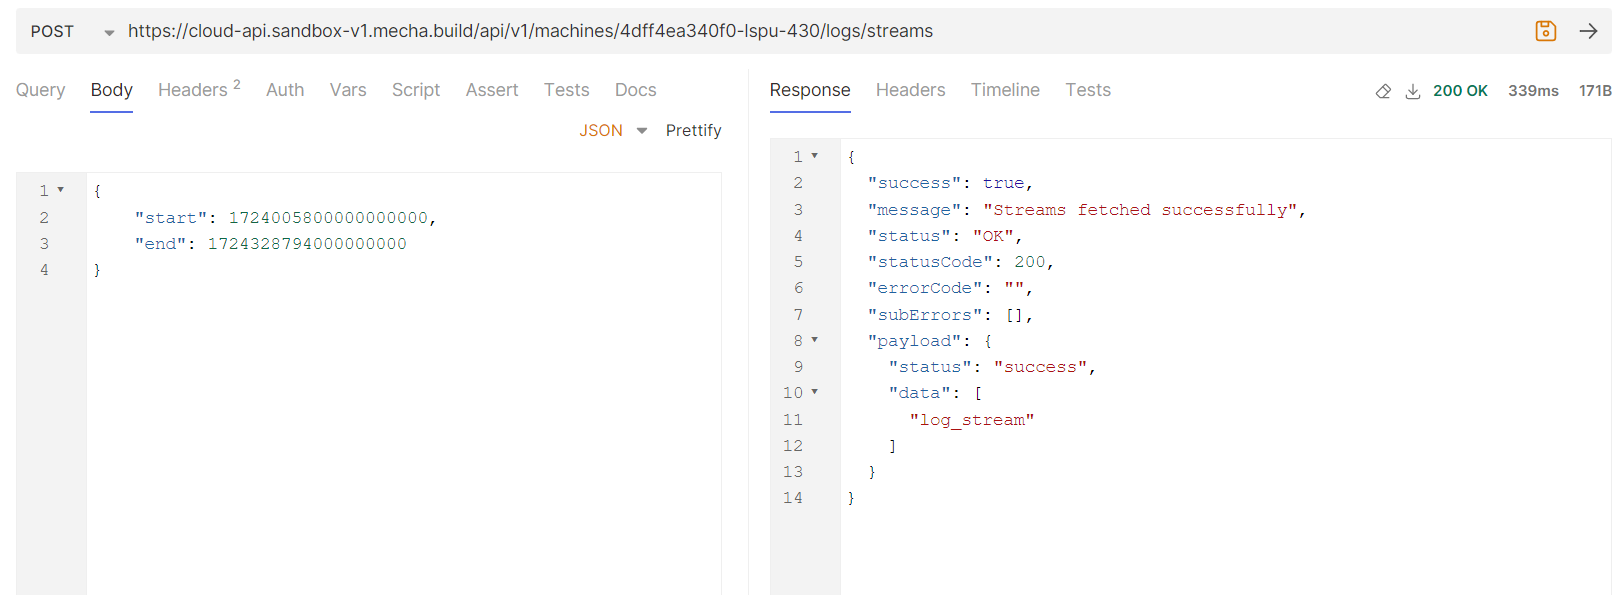
To get logs data first need to get streams data, as there is stream filter for getting logs. Log streams refer to the continuous, real-time transmission of log data from various sources (like the examples above) to a centralized logging system or analytics platform. This allows for real-time monitoring, analysis, and alerting based on the incoming log data.
To fetch streams below API is used with machines machine ID or alias and time range filter, start, end : Timestamp in epoch nano seconds
Reference : Bruno screenshot
To fetch logs below API is used, start, end : Timestamp in epoch nano seconds limit : Possible values are
<= 100search : In search you can provide the search text Reference : Bruno screenshot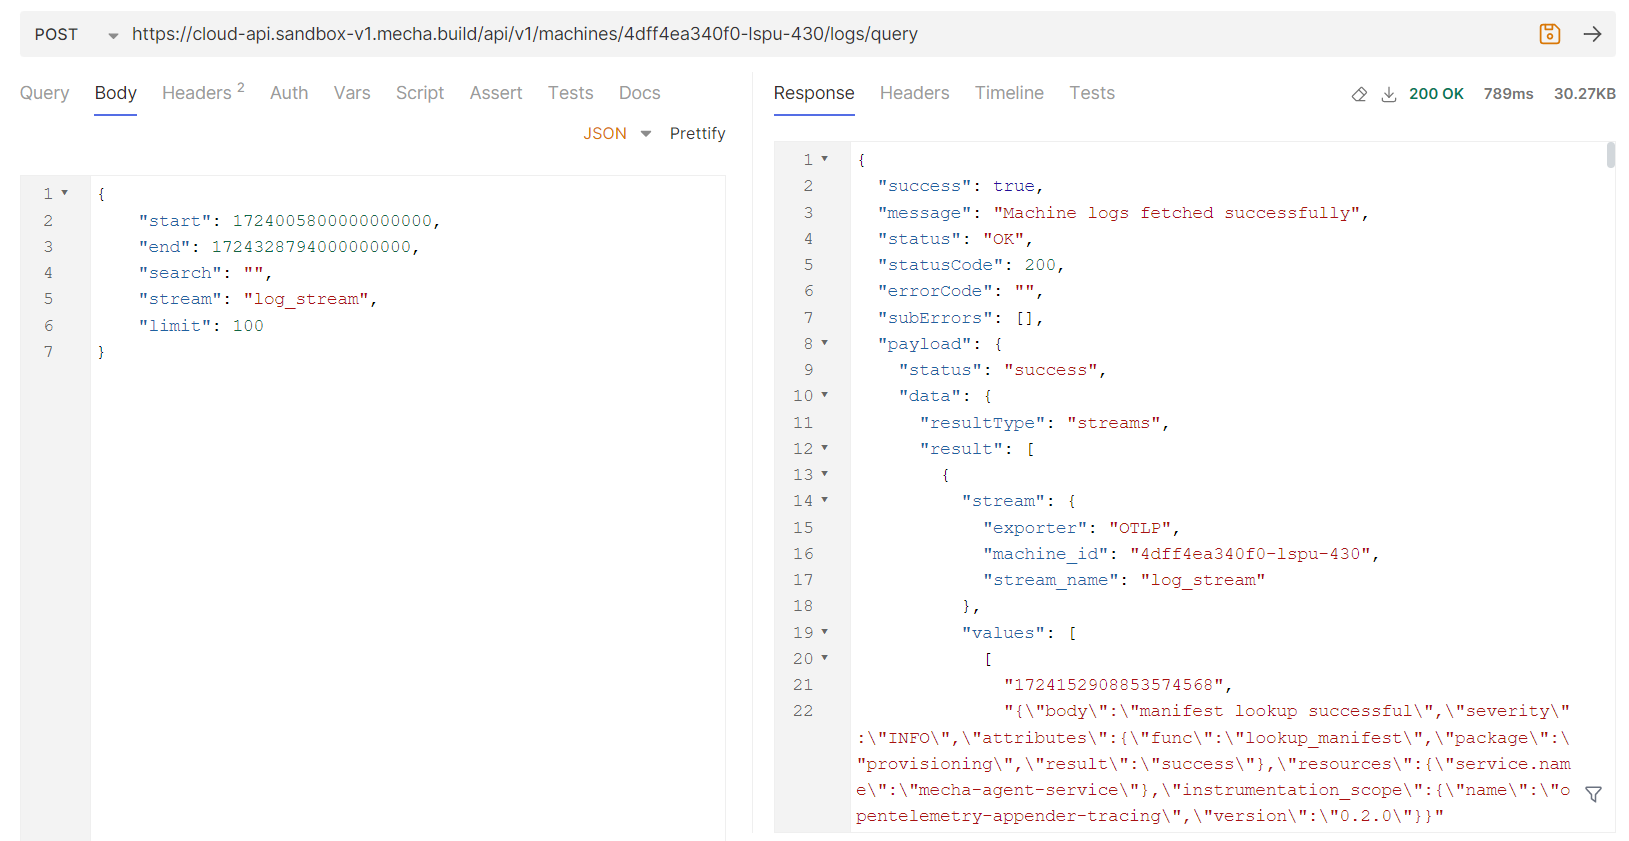
Note : Logs data is only collected if logs collection is enabled in machine telemetry.
-
Exporting logs :
For export logs, similar to get logs first fetch the streams.
To export logs below API is used,
start, end : Timestamp in epoch nano seconds search : In search you can provide the search text
Reference : Bruno screenshot
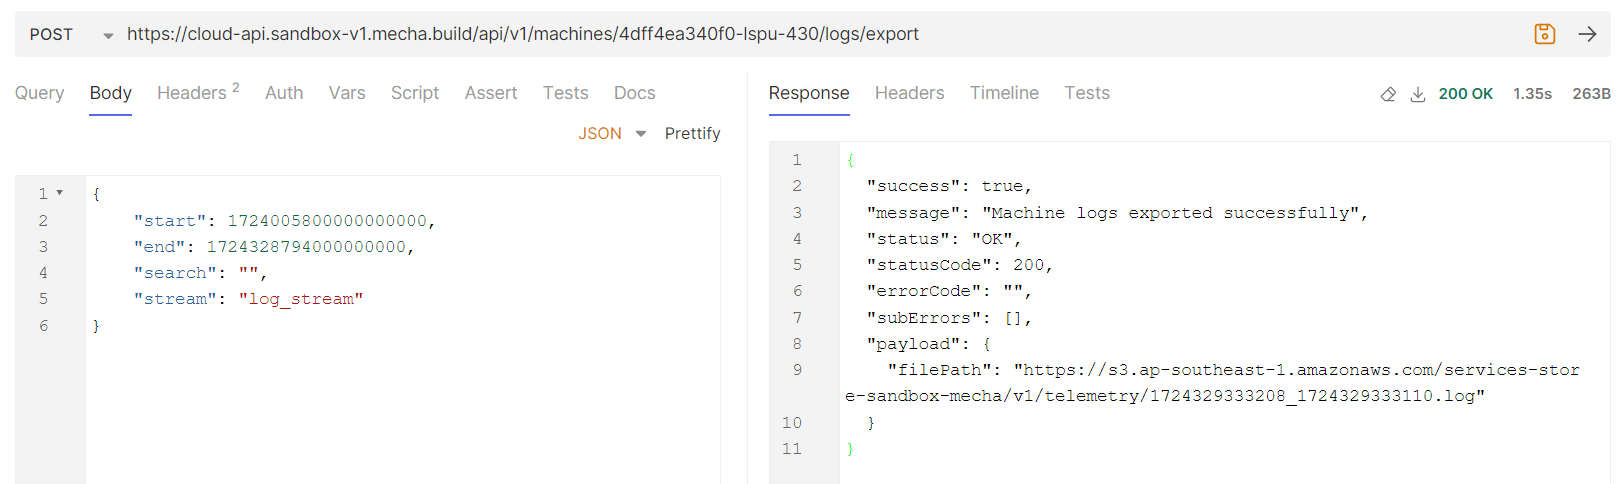
Using export logs API you can download the logs data.
-