Generate Grafana Single Sign-On URL
Grafana Single Sign-On (SSO) URL using JWT (JSON Web Tokens), Grafana will accept JWT tokens for authentication. This approach involves embedding user authentication data in a JWT token that Grafana can validate.
Generate the JWT Token:
- Create a JWT token that contains the necessary claims (such as username, roles, etc.) required by Grafana.
- Always include an expiration (
exp) claim in the JWT to limit its validity period. Token validity is 24 hours. - Sign the token using the secret key that Grafana is configured to use for validating the JWT.
Construct the Grafana SSO URL:
- Once you have the JWT token, you can embed the JWT token in the URL as a query parameter to allow users to authenticate directly via the token.
There is one API which can generate the token and also generate the explore url for metrics or logs, When the grafana API is called first time, then in Grafana Organization, User, Datasources, Dashboard created. And if next time the API is called then check for any updated needed, and if needed then updates can be done .
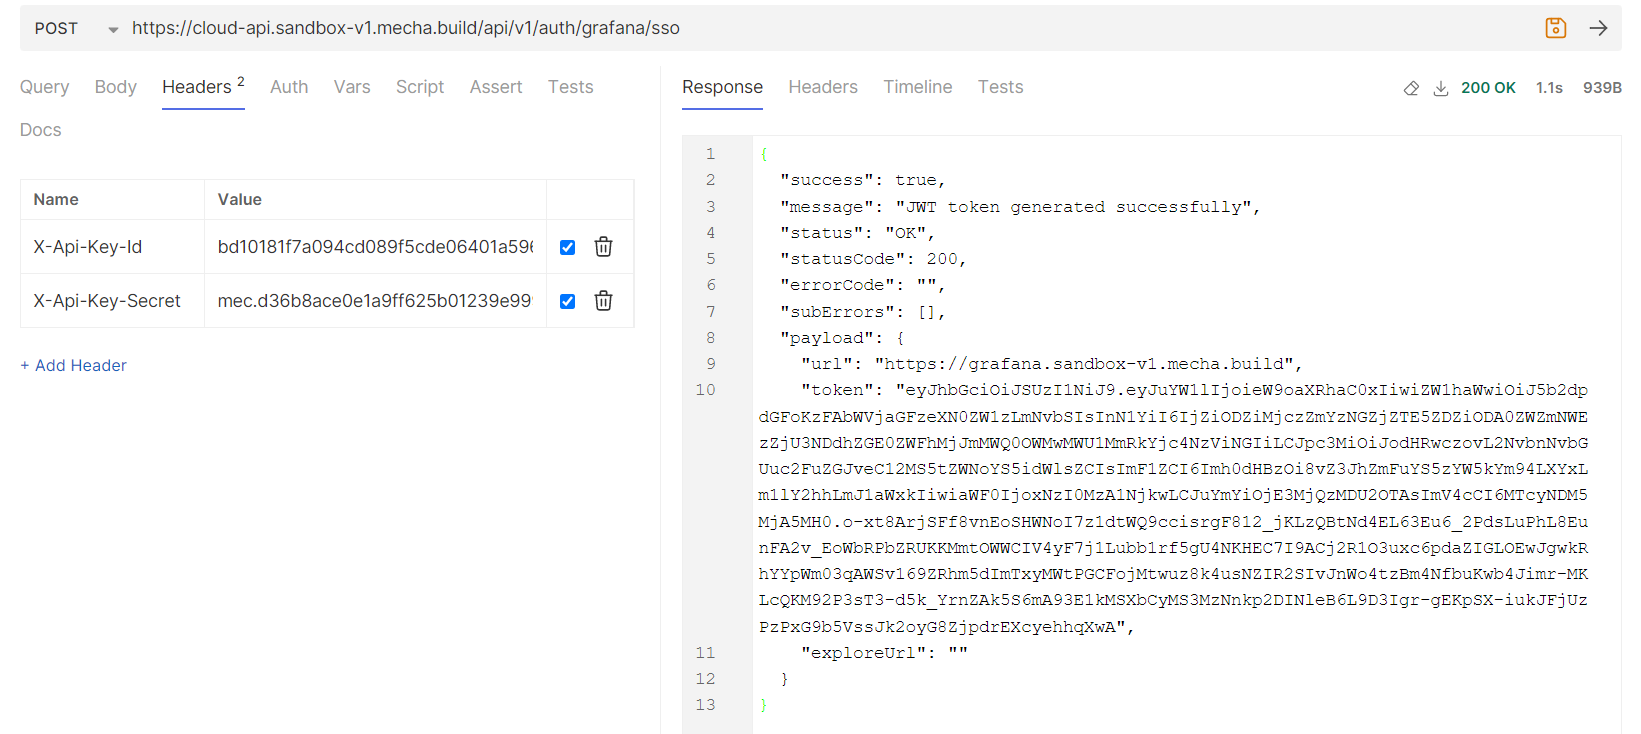
- Launch Grafana : By passing empty request body you can get the grafana url and token to launch grafana, Final launch url can be generated as below,
https://grafana.sandbox-v1.mecha.build?auth_token=eyJhbGciOiJSUzI1NiJ9.eyJuYW1lIjoieW9oaXRhaC0xIiwiZW1haWwiOiJ5b2dpdGFoKzFAbWVjaGFzeXN0ZW1zLmNvbSIsInN1YiI6IjZiODZiMjczZmYzNGZjZTE5ZDZiODA0ZWZmNWEzZjU3NDdhZGE0ZWFhMjJmMWQ0OWMwMWU1MmRkYjc……
Reference : Bruno Screenshot
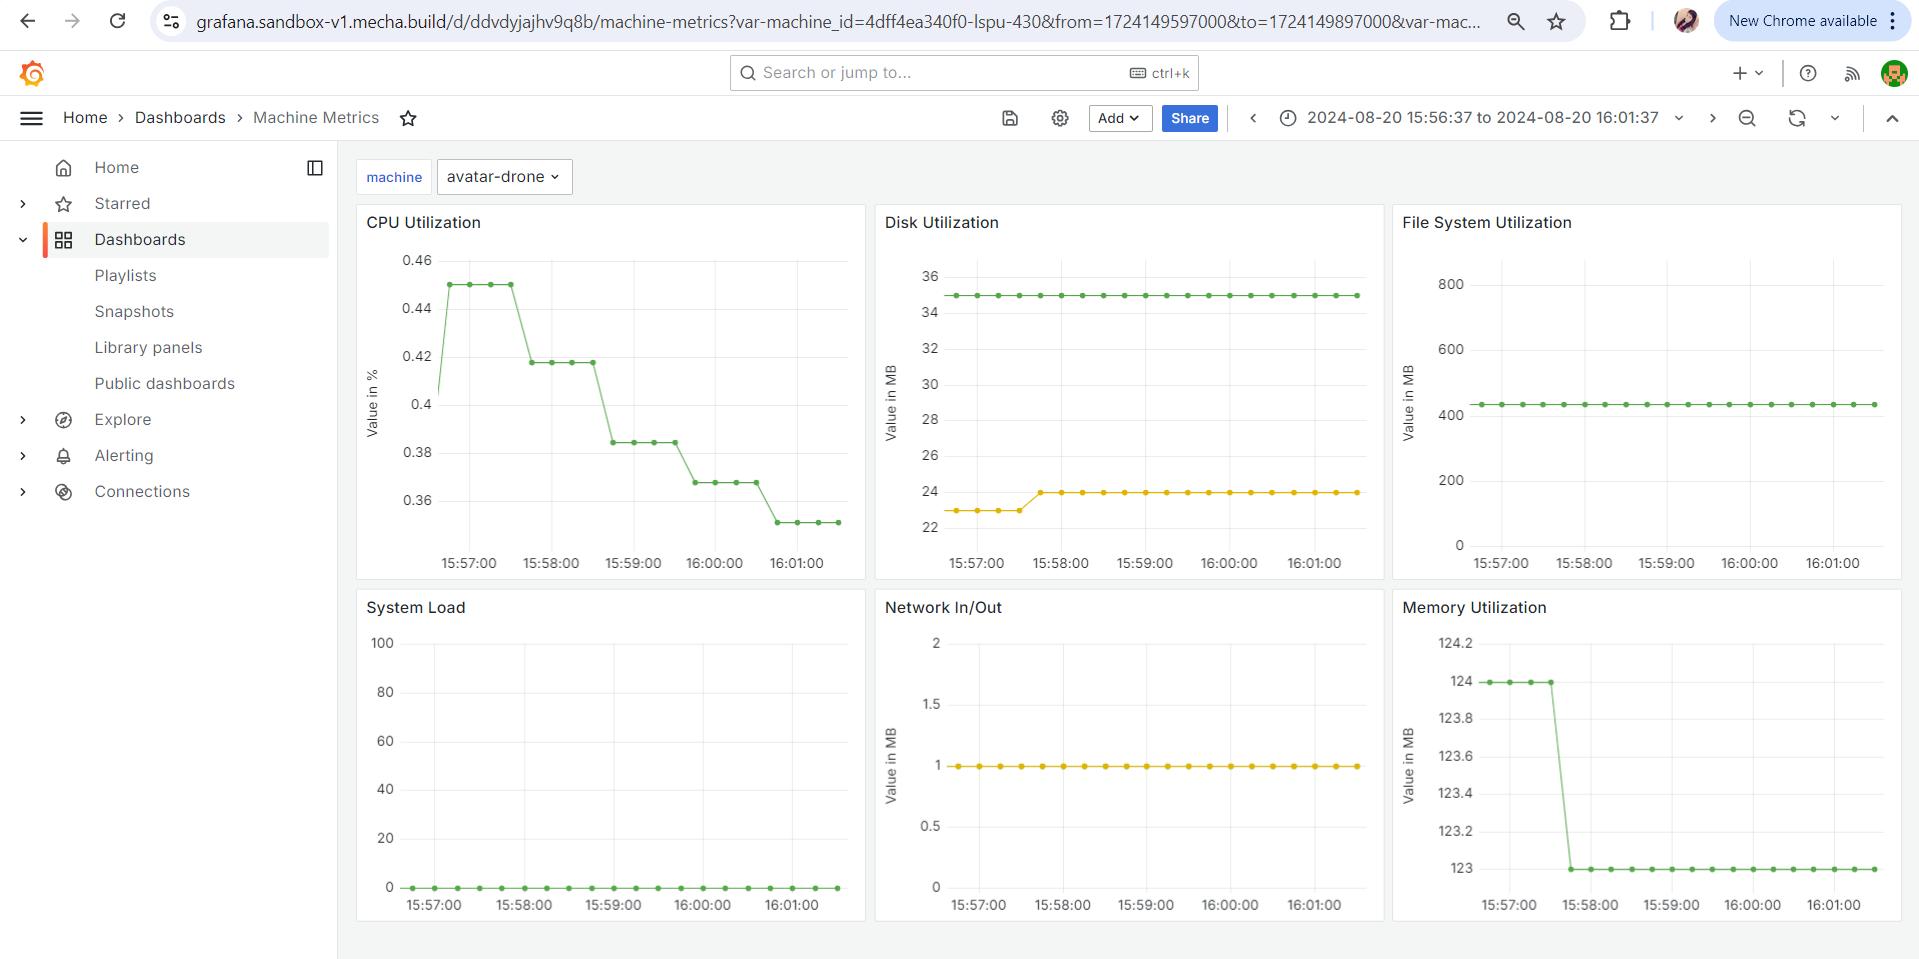
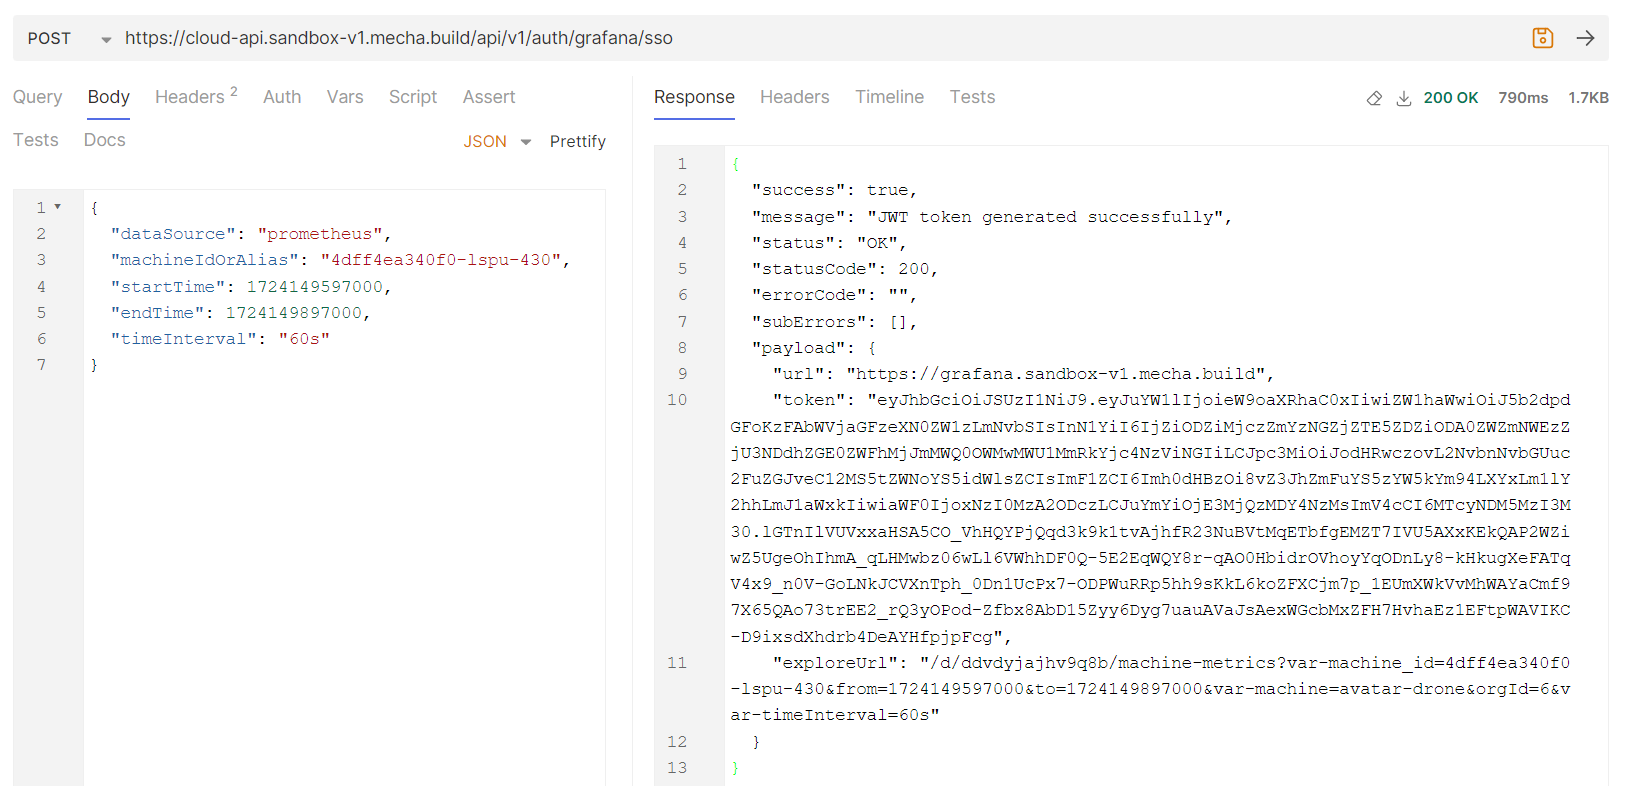
- Explore metrics By providing the metrics related data in request body you can get explore url for metrics, as shown in below screenshot, startTime and endTime are timestamp in epoch milliseconds
The explore url can be constructed as below, using the API response, this explore url will open the Grafana dashboard for metrics where you can have metrics graphs as shown in screenshot.
https://grafana.sandbox-v1.mecha.build/d/ddvdyjajhv9q8b/machine-metrics?var-machine_id=4dff4ea340f0-lspu-430&from=1724149597000&to=1724149897000&var-machine=avatar-drone&orgId=6&var-timeInterval=60s&auth_token=eyJhbGciOiJSUzI1NiJ9.eyJuYW1lIjoieW9oaXRhaC0xIiwiZW1haWwiOiJ5b2dpdGFoKzFAbWVjaGFzeXN0ZW1zLmNvbSIsInN1YiI6IjZiODZiMjczZmYzNGZjZTE5ZDZiODA0ZWZmNWEzZjU3NDdhZGE0ZWFhMjJmMWQ0OWMwMWU1MmRkYjc4NzViNGIiLCJpc3MiOiJodHRwczovL2NvbnNvbGUuc2FuZGJveC12MS5tZWNoYS5idWlsZCIsImF1ZCI6Imh0dHBzOi8vZ3JhZmFuYS5zYW5kYm94LXYxLm1lY2hhLmJ1aWxkIiwiaWF0IjoxNzI0MTcz….
Reference : Grafana screenshot
Reference : Bruno screenshot
-
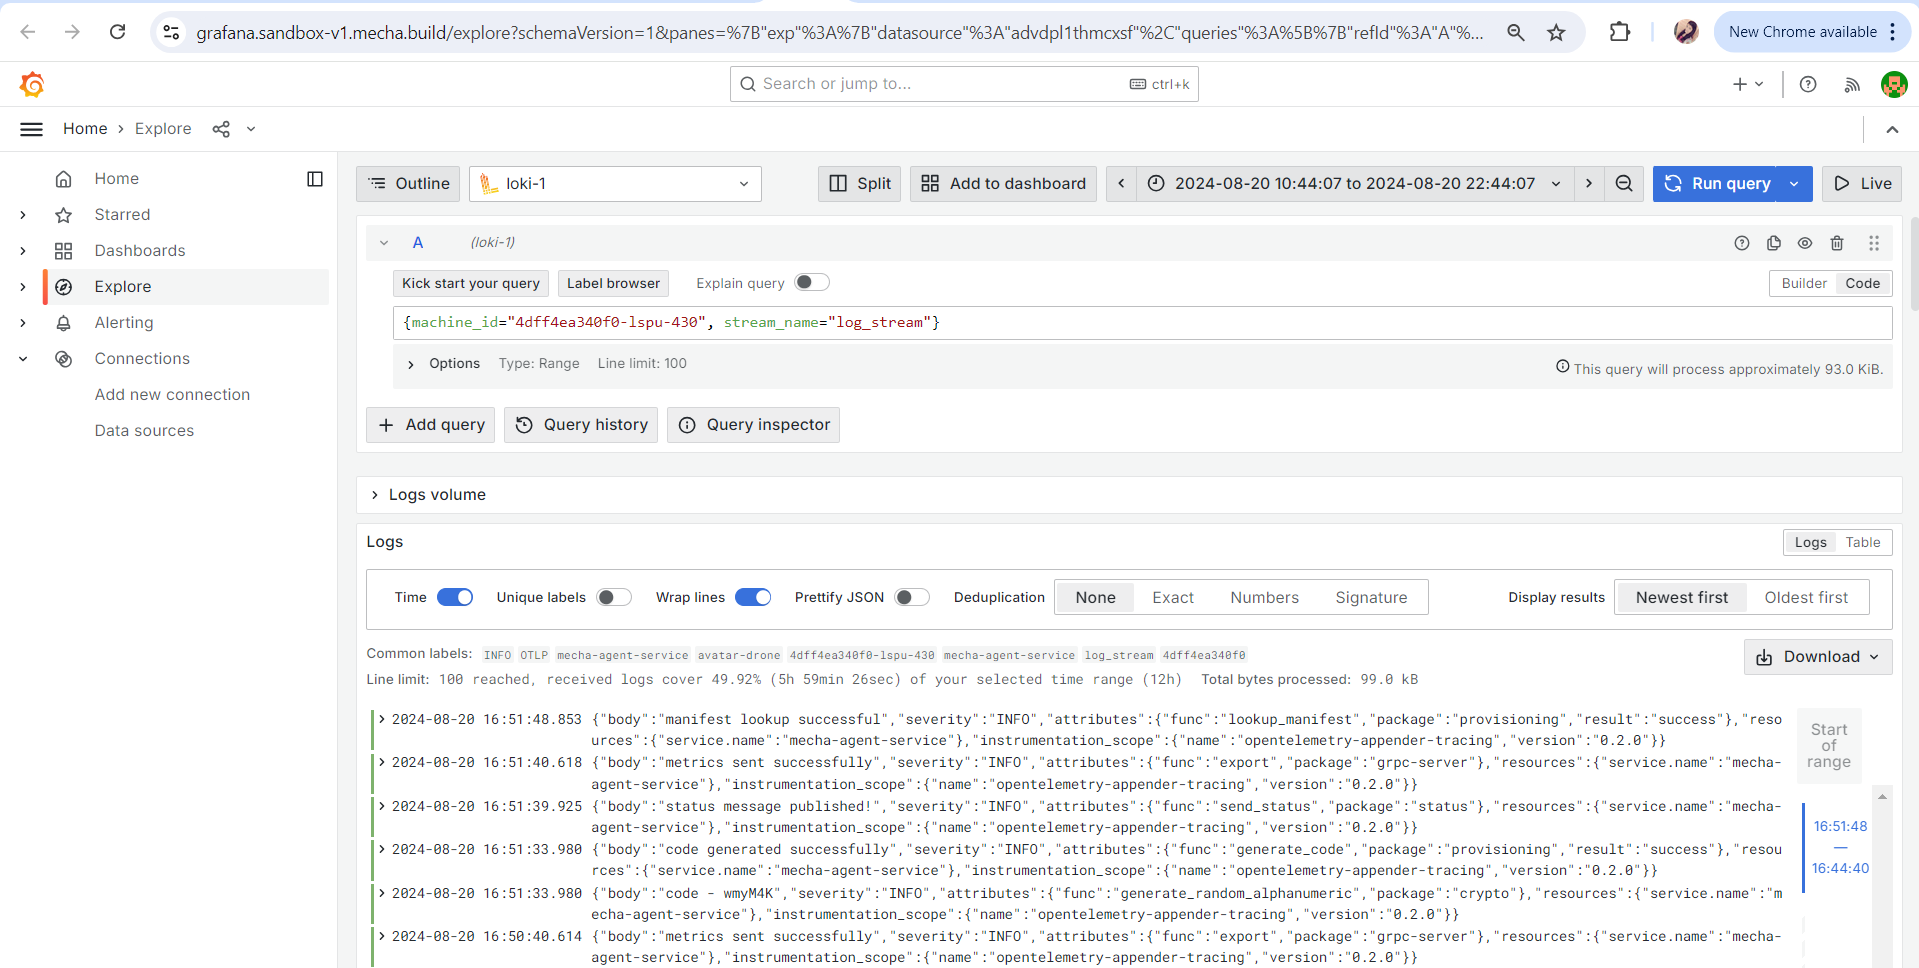
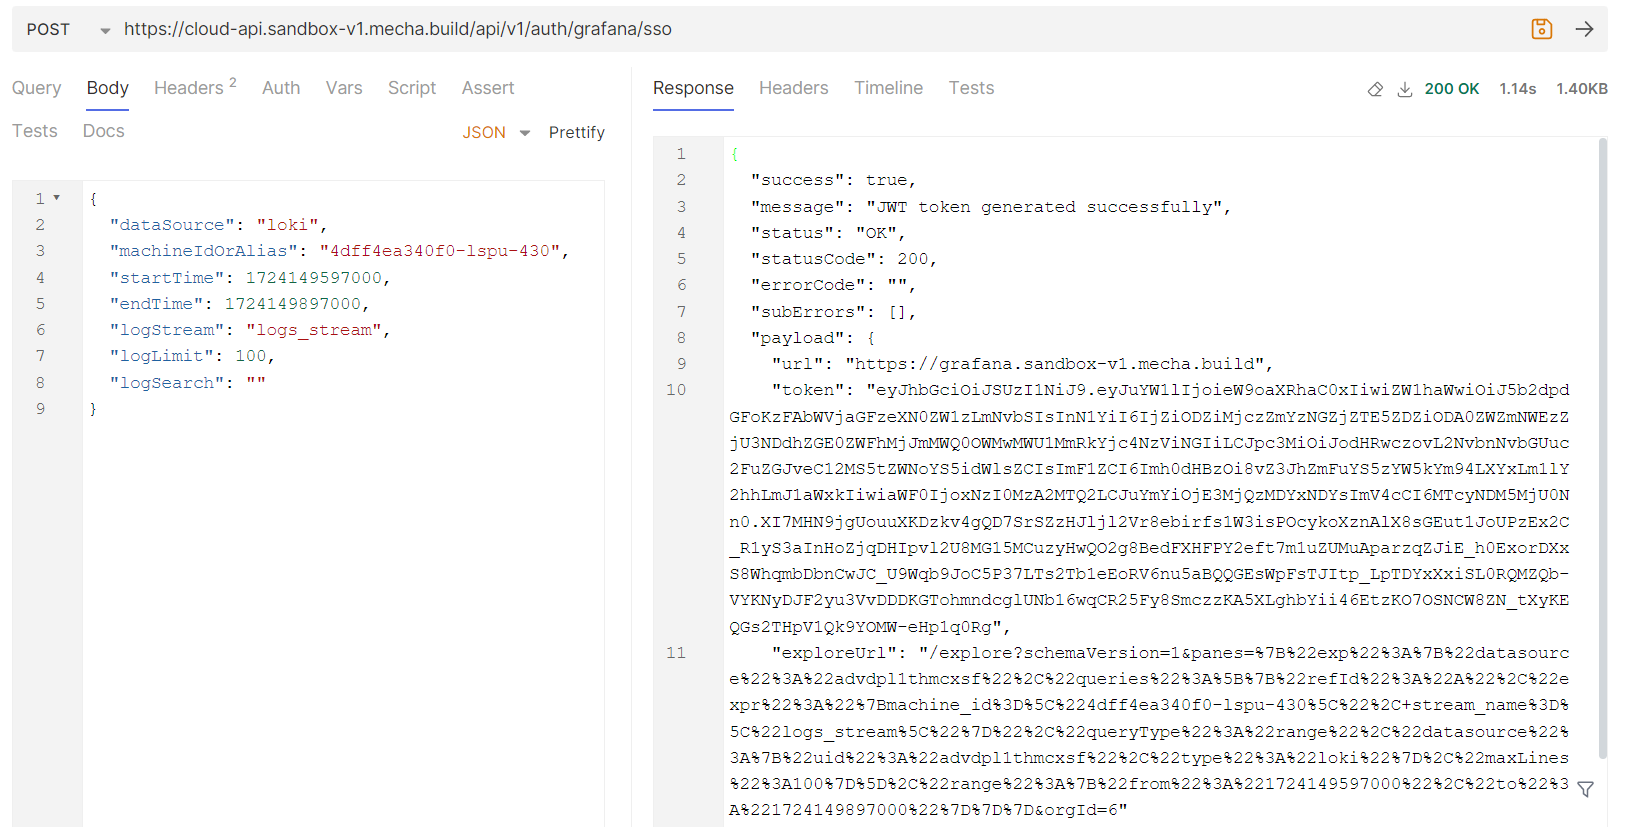
Explore logs
Simlilar to explore metrics, you can provide logs related data in request body to get logs explore url,
startTime and endTime are timestamp in epoch milliseconds
The explore url can be constructed as below, using the API response, this explore url will open the Grafana explore page for logs where you can see the logs.
https://grafana.sandbox-v1.mecha.build/explore?schemaVersion=1&panes=%7B%22exp%22%3A%7B%22datasource%22%3A%22advdpl1thmcxsf%22%2C%22queries%22%3A%5B%7B%22refId%22%3A%22A%22%2C%22expr%22%3A%22%7Bmachine_id%3D%5C%224dff4ea340f0-lspu-430%5C%22%2C+stream_name%3D%5C%22logs_stream%5C%22%7D%22%2C%22queryType%22%3A%22range%22%2C%22datasource%22%3A%7B%22uid%22%3A%22advdpl1thmcxsf%22%2C%22type%22%3A%22loki%22%7D%2C%22maxLines%22%3A100%7D%5D%2C%22range%22%3A%7B%22from%22%3A%221724149597000%22%2C%22to%22%3A%221724149897000%22%7D%7D%7D&orgId=6&auth_token=eyJhbGciOiJSUzI1NiJ9.eyJuYW1lIjoieW9oaXRhaC0xIiwiZW1haWwiOiJ5b2dpdGFoKzFAbWVjaGFzeXN0ZW1zLmNvbSIsInN1YiI6IjZiODZiMjczZmYzNGZjZTE5ZDZiODA0ZWZmNWEzZjU3NDdhZGE0ZWFhMjJmMWQ0OWMwMWU1MmRkYjc4NzViNGIiLCJpc3MiOiJodHRwczovL2NvbnNvbGUuc2FuZGJveC12MS5tZWNoYS5idWlsZCIsImF1ZCI6Imh0dHBzOi8vZ3JhZmFuYS5zYW5kYm94LXYxLm1lY2hhLmJ1aWxkIiwiaWF0IjoxNzI0MTcz….
Reference : Bruno Screenshot
Reference : Grafana Screenshot